Marker Genes Calculation and Visualization
Loading Packages
[ ]:
import warnings
warnings.filterwarnings('ignore')

import scanpy as sc
import matplotlib.pyplot as plt
import numpy as np
import pandas as pd
from sklearn.preprocessing import MinMaxScaler

import sys
sys.path.append(r'../../../')
from SpatialCOC.preprocess import preprocessing
from SpatialCOC.utils import fix_seed, rotate_spatial_coordinates, reorder_categories, replace_extreme_values
fix_seed(2024)
Loading Data
[9]:
slice_id = 4    ## 1, 2, 3, 4

slice_name = ['ATAC', 'H3K4me3', 'H3K27ac', 'H3K27me3']

adata_modality_1 = sc.read_h5ad(f"../../../Data/Mouse_Brain_{slice_name[slice_id-1]}/adata_RNA.h5ad")
adata_modality_2 = sc.read_h5ad(f"../../../Data/Mouse_Brain_{slice_name[slice_id-1]}/adata_peaks_normalized.h5ad")
adata_modality_1, adata_modality_2 = preprocessing(adata_modality_1, adata_modality_2, 'Spatial-epigenome-transcriptome')

adata_results = sc.read_h5ad(f"../../Mouse_Brain_{slice_name[slice_id-1]}.h5ad")
Spatial-epigenome-transcriptome data preprocessing have done!
Dimensions after preprocessed adata_modal_1: (9732, 3000)
Dimensions after preprocessing adata_modal_2: (9732, 70470)
Calculating Marker Genes
[10]:
adata_modality_1.obs['SpaKnit'] = adata_results.obs['SpaKnit']

## calculate the marker genes
sc.tl.dendrogram(adata_modality_1, groupby='SpaKnit')
sc.tl.rank_genes_groups(adata_modality_1, groupby='SpaKnit', use_raw=False)

## store the results
rank_genes = sc.get.rank_genes_groups_df(adata_modality_1, group=None)
rank_genes.to_excel(f"{slice_name[slice_id-1]}/Marker_Genes.xlsx", index=True)
WARNING: Default of the method has been changed to 't-test' from 't-test_overestim_var'
Ploting Spatial Distribution of Marker Genes
[40]:
## Define Marker gene list
gene_list = {
    'ATAC':     ['Cpne9', 'Nr4a2', 'Myh11', 'Sox4', 'Pde10a', 'Plp1'],
    'H3K4me3':  ['X3110035E14Rik', 'Mef2c', 'Syt1', 'C1ql3', 'Wipf3', 'Myh11', 'Pde10a', 'Mobp'],
    'H3K27ac':  ['Usp46', 'Nefm', 'Mef2c', 'Col1a2', 'Zbtb20', 'Pde10a', 'Mobp'],
    'H3K27me3': ['X3110035E14Rik', 'Mef2c', 'Syt1', 'C1ql3', 'Wipf3', 'Myh11', 'Pde10a', 'Mobp']
}

for slice_id in range(0, 4):
    current_slice = slice_name[slice_id]
    print(f"Processing slice: {current_slice}")

    # Read data
    adata_modality_1 = sc.read_h5ad(f"../../../Data/Mouse_Brain_{current_slice}/adata_RNA.h5ad")

    # Data preprocessing
    sc.pp.filter_genes(adata_modality_1, min_cells=10)
    sc.pp.filter_cells(adata_modality_1, min_genes=200)
    sc.pp.highly_variable_genes(adata_modality_1, flavor="seurat_v3", n_top_genes=3000)
    sc.pp.normalize_total(adata_modality_1, target_sum=1e4)

    # Get the marker genes for the current slice
    current_genes = gene_list[current_slice]
    num_genes = len(current_genes)

    # Set plotting parameters
    plt.rcParams['font.size'] = 18
    plt.rcParams['font.sans-serif'] = 'Arial'

    # Create subplots
    fig, axs = plt.subplots(1, num_genes, figsize=(num_genes * 4, 4), squeeze=False)

    # Determine rotation angle based on slice_id
    rotation_angle = 0
    if slice_id == 1 or slice_id == 2:  # Rotate 90 degrees clockwise for the second and third slices
        rotation_angle = 90
    elif slice_id == 3:  # Rotate 270 degrees clockwise for the fourth slice
        rotation_angle = 270

    if rotation_angle != 0:
        original_spatial = adata_modality_1.obsm['spatial'].copy()
        # Rotate coordinates
        adata_modality_1.obsm['spatial'] = rotate_spatial_coordinates(original_spatial, rotation_angle)

    # Iterate over each gene and plot
    for i, gene in enumerate(current_genes):
        try:
            expression = adata_modality_1[:, gene].X.toarray().flatten()
            # Replace extreme values
            adata_modality_1[:, gene].X = replace_extreme_values(expression, n=0.01)
            # Plot spatial expression
            sc.pl.embedding(adata_modality_1, basis='spatial', color=gene, ax=axs[0, i], s=50, colorbar_loc=None, show=False, cmap='YlGnBu')

            # Remove spines and axis labels
            for spine in axs[0, i].spines.values():
                spine.set_visible(False)
            axs[0, i].set_xlabel('')
            axs[0, i].set_ylabel('')
            axs[0, i].set_title('')
            if slice_id == 3:
                axs[0, i].invert_xaxis()
        except KeyError:
            print(f"Gene {gene} not found in {current_slice} data.")
            continue

    # Adjust layout
    plt.subplots_adjust(wspace=0, hspace=0)
    plt.tight_layout()

    # Save figures
    plt.savefig(f'{slice_name[slice_id]}/Marker_Genes_Spatial_{slice_name[slice_id]}.png', dpi=500)
    plt.savefig(f'{slice_name[slice_id]}/Marker_Genes_Spatial_{slice_name[slice_id]}.eps')

    plt.show()
Processing slice: ATAC

Processing slice: H3K4me3

Processing slice: H3K27ac

Processing slice: H3K27me3

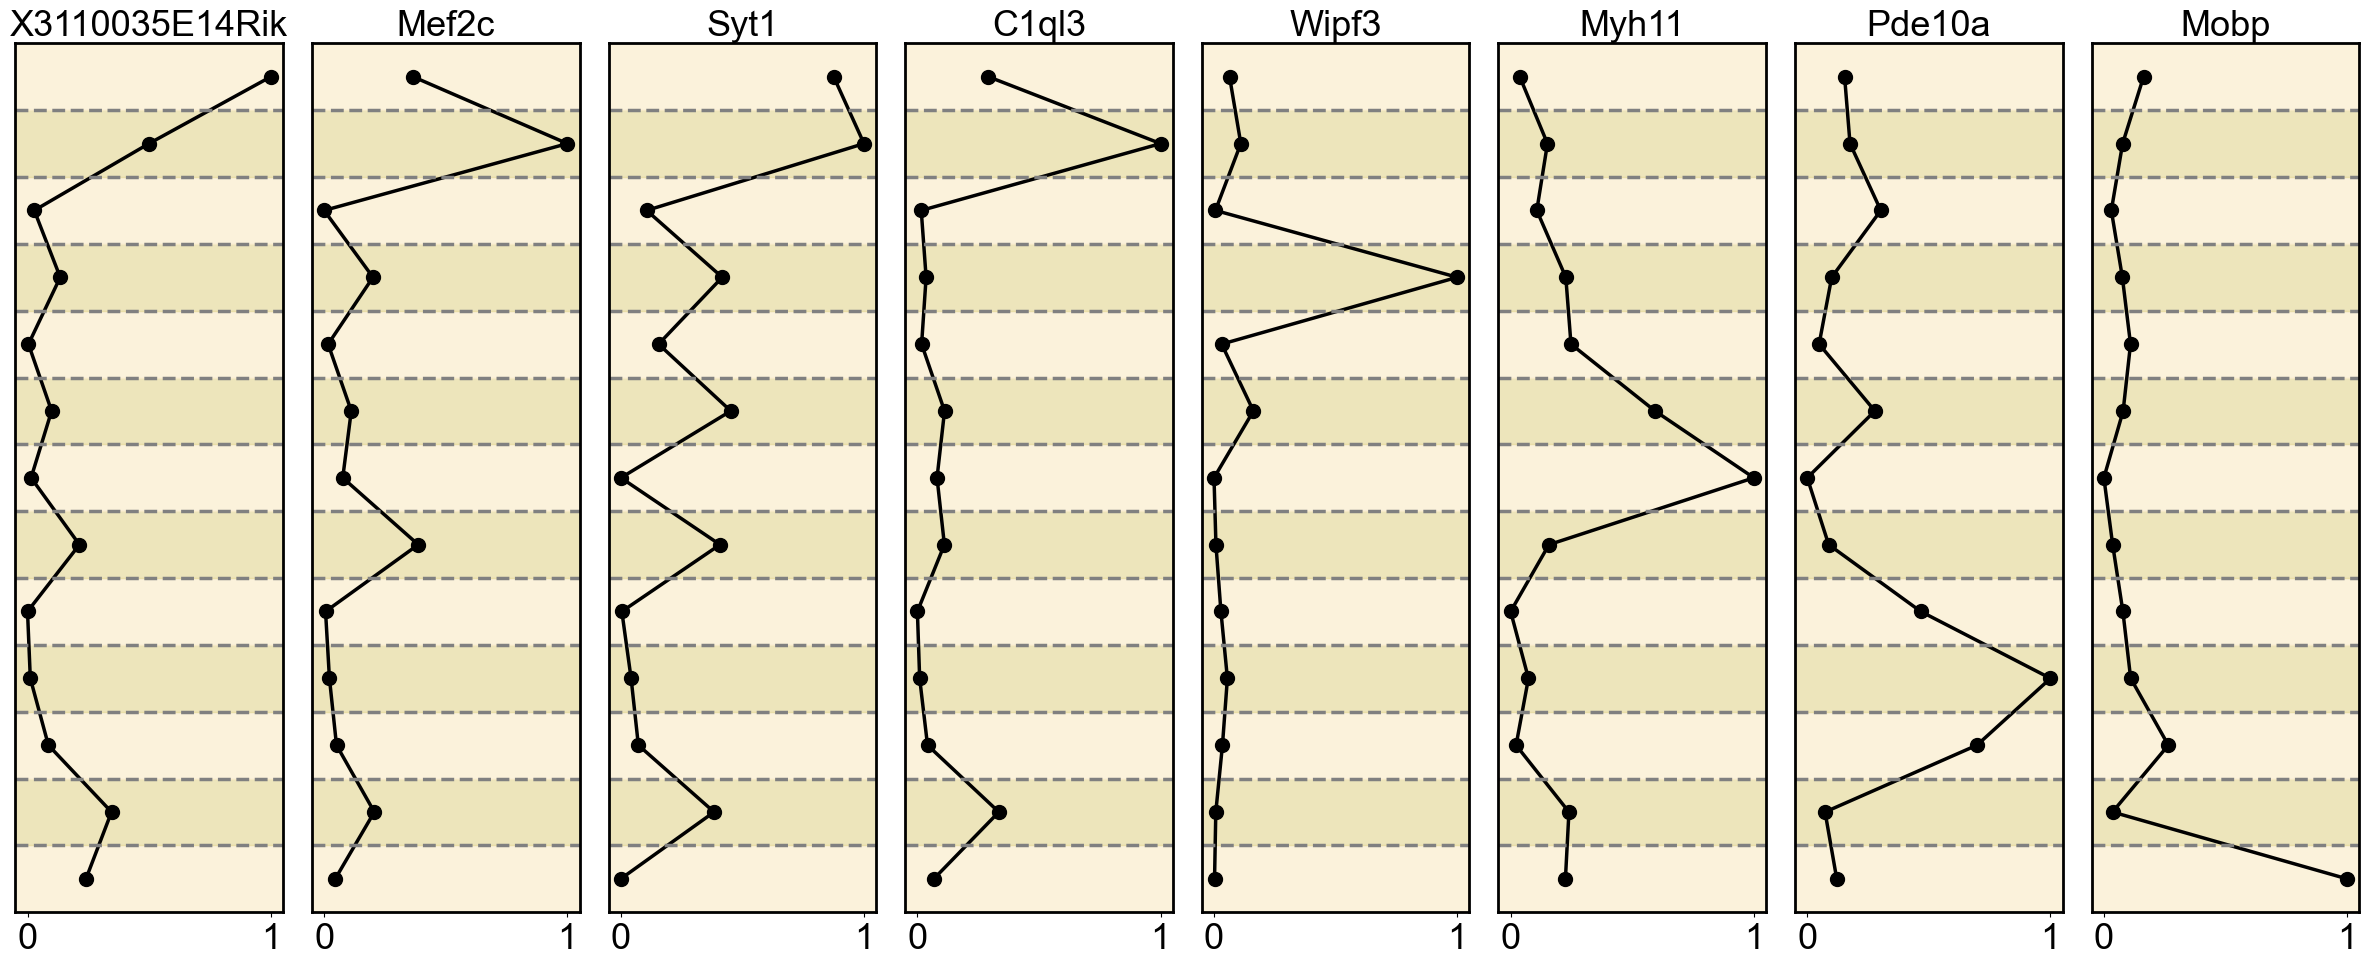
Ploting the Marker genes’ Expression
[146]:
import scanpy as sc
import pandas as pd
import matplotlib.pyplot as plt
import numpy as np
from sklearn.preprocessing import MinMaxScaler

# Define the new orders for each modality
new_orders = {
    'ATAC':     ["3", "2", "9", "7", "1", "10", "4", "8", "11", "0", "12", "5", "6"],
    'H3K4me3':  ["4", "2", "3", "7", "10", "5", "8", "11", "9", "1", "0", "6"],
    'H3K27ac':  ["2", "7", "3", "4", "10", "5", "9", "8", "11", "0", "1", "6"],
    'H3K27me3': ["3", "8", "9", "11", "2", "12", "4", "1", "6", "0", "10", "5", "7"]
}

# Define the colors for the background
colors = ['#faedcd', '#e6db9e']

# Iterate over each slice_id
for slice_id in range(4):
    current_slice = slice_name[slice_id]

    # Load the data
    adata_modality_1 = sc.read_h5ad(f"../../../Data/Mouse_Brain_{current_slice}/adata_RNA.h5ad")
    adata_results = sc.read_h5ad(f"../../Mouse_Brain_{current_slice}.h5ad")

    # Reorder categories
    reorder_categories(adata_results, 'SpaKnit', new_orders[current_slice])

    # Set the figure size and subplot layout
    fig, axes = plt.subplots(nrows=1, ncols=len(gene_list[current_slice]), figsize=(len(gene_list[current_slice]) * 3, 10))

    # Iterate over the gene list and create a subplot for each gene
    for i, gene in enumerate(gene_list[current_slice]):
        # Extract the expression data for the target gene
        gene_expression = adata_modality_1[:, gene].X.toarray()

        # Convert the expression data to a pandas Series
        gene_expression_series = pd.Series(gene_expression.flatten(), index=adata_modality_1.obs.index)

        # Extract cell type labels
        cell_types = adata_results.obs['SpaKnit']

        # Merge gene expression data and cell type labels into a DataFrame
        df = pd.DataFrame({'gene_expression': gene_expression_series, 'cell_type': cell_types})

        # Group by cell type and calculate the mean gene expression for each group
        mean_expression_by_cell_type = df.groupby('cell_type')['gene_expression'].mean()

        # Normalize the mean expression values to the range [0, 1]
        scaler = MinMaxScaler()
        normalized_expression = scaler.fit_transform(mean_expression_by_cell_type.values.reshape(-1, 1)).flatten()

        # Plot the normalized line chart
        ax = axes[i]  # Get the current subplot axis object
        ax.plot(normalized_expression, mean_expression_by_cell_type.index, marker='o', color='black', linewidth=2.5, markersize=10)
        ax.set_yticks([])  # Remove y-axis labels
        ax.set_ylim([-0.5, len(new_orders[current_slice])-0.5])  # Set y-axis limits
        ax.invert_yaxis()  # Invert the y-axis
        ax.set_xlim(-0.05, 1.05)  # Set x-axis limits
        ax.set_xticks([0, 1])  # Display only 0 and 1 on the x-axis
        ax.tick_params(axis='x', labelsize=26)

        ax.set_title(gene, fontsize=26)
        for spine in ax.spines.values():
            spine.set_linewidth(2)  # Set the border line width to 2
        y_min, y_max = ax.get_ylim()
        num_intervals = len(new_orders[current_slice])
        y_intervals = np.linspace(y_min, y_max, num_intervals + 1)
        for j in range(num_intervals):
            lower_bound = y_intervals[j]
            upper_bound = y_intervals[j + 1]
            # Select color using modulo operation
            color = colors[j % 2]
            ax.axhspan(lower_bound, upper_bound, color=color, alpha=0.7)
            # Draw a gray dashed line at the upper boundary of each interval
            if j < num_intervals - 1:  # Avoid drawing at the upper boundary of the last interval
                ax.axhline(upper_bound, color='gray', linestyle='--', linewidth=2.5, alpha=1)

    plt.tight_layout()

    plt.savefig(f'{current_slice}/Marker_Gene_Expression_{current_slice}.png', dpi=500)
    plt.savefig(f'{current_slice}/Marker_Gene_Expression_{current_slice}.eps')
    plt.show()
The PostScript backend does not support transparency; partially transparent artists will be rendered opaque.
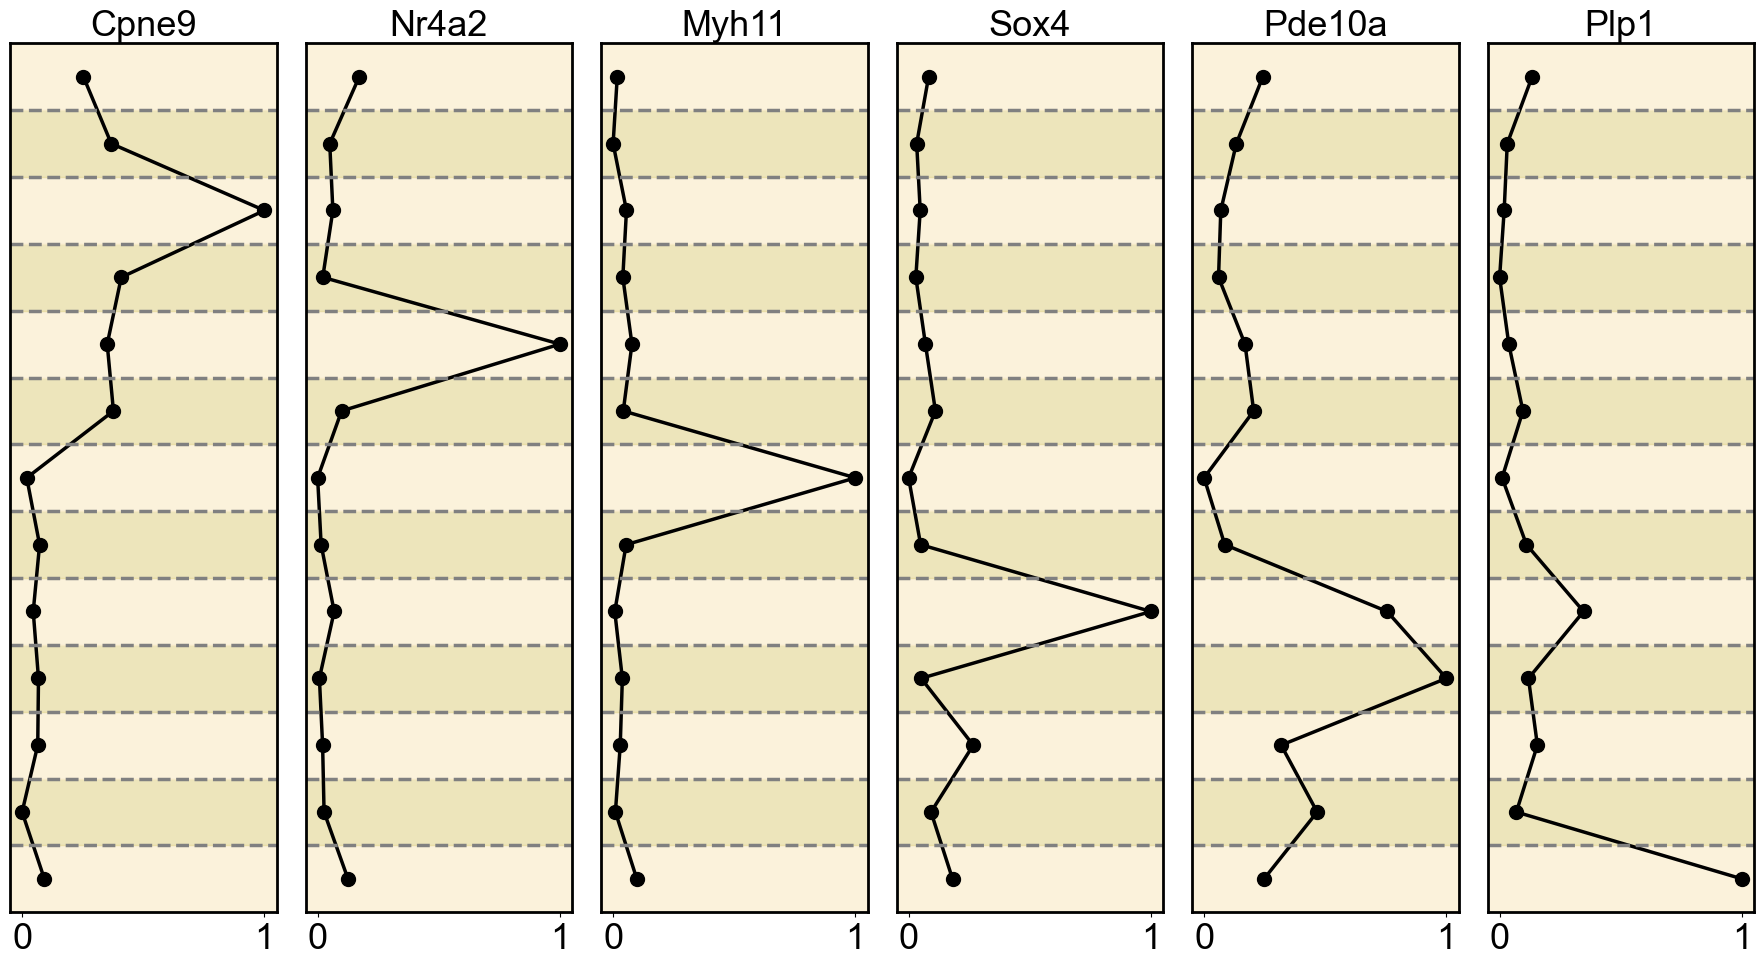
The PostScript backend does not support transparency; partially transparent artists will be rendered opaque.
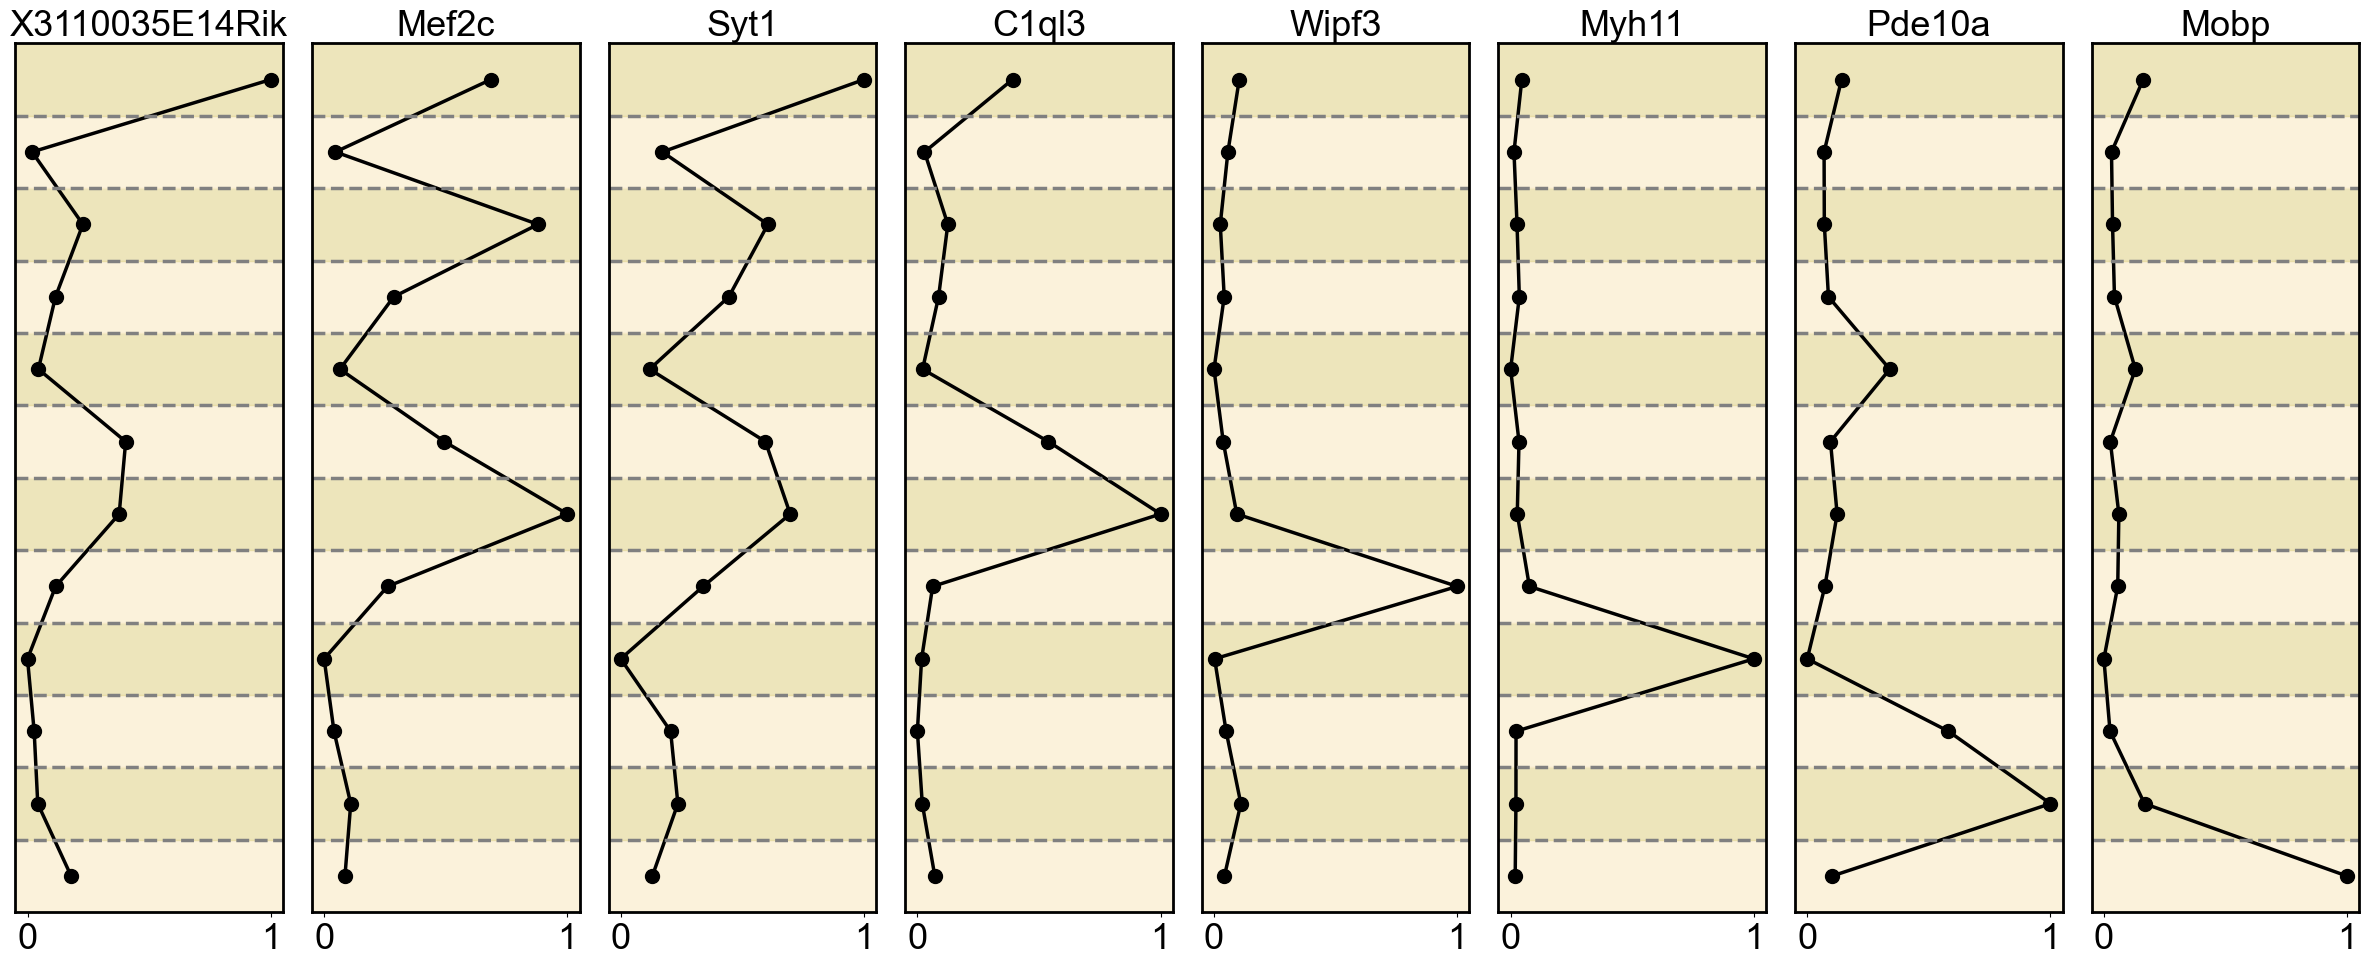
The PostScript backend does not support transparency; partially transparent artists will be rendered opaque.
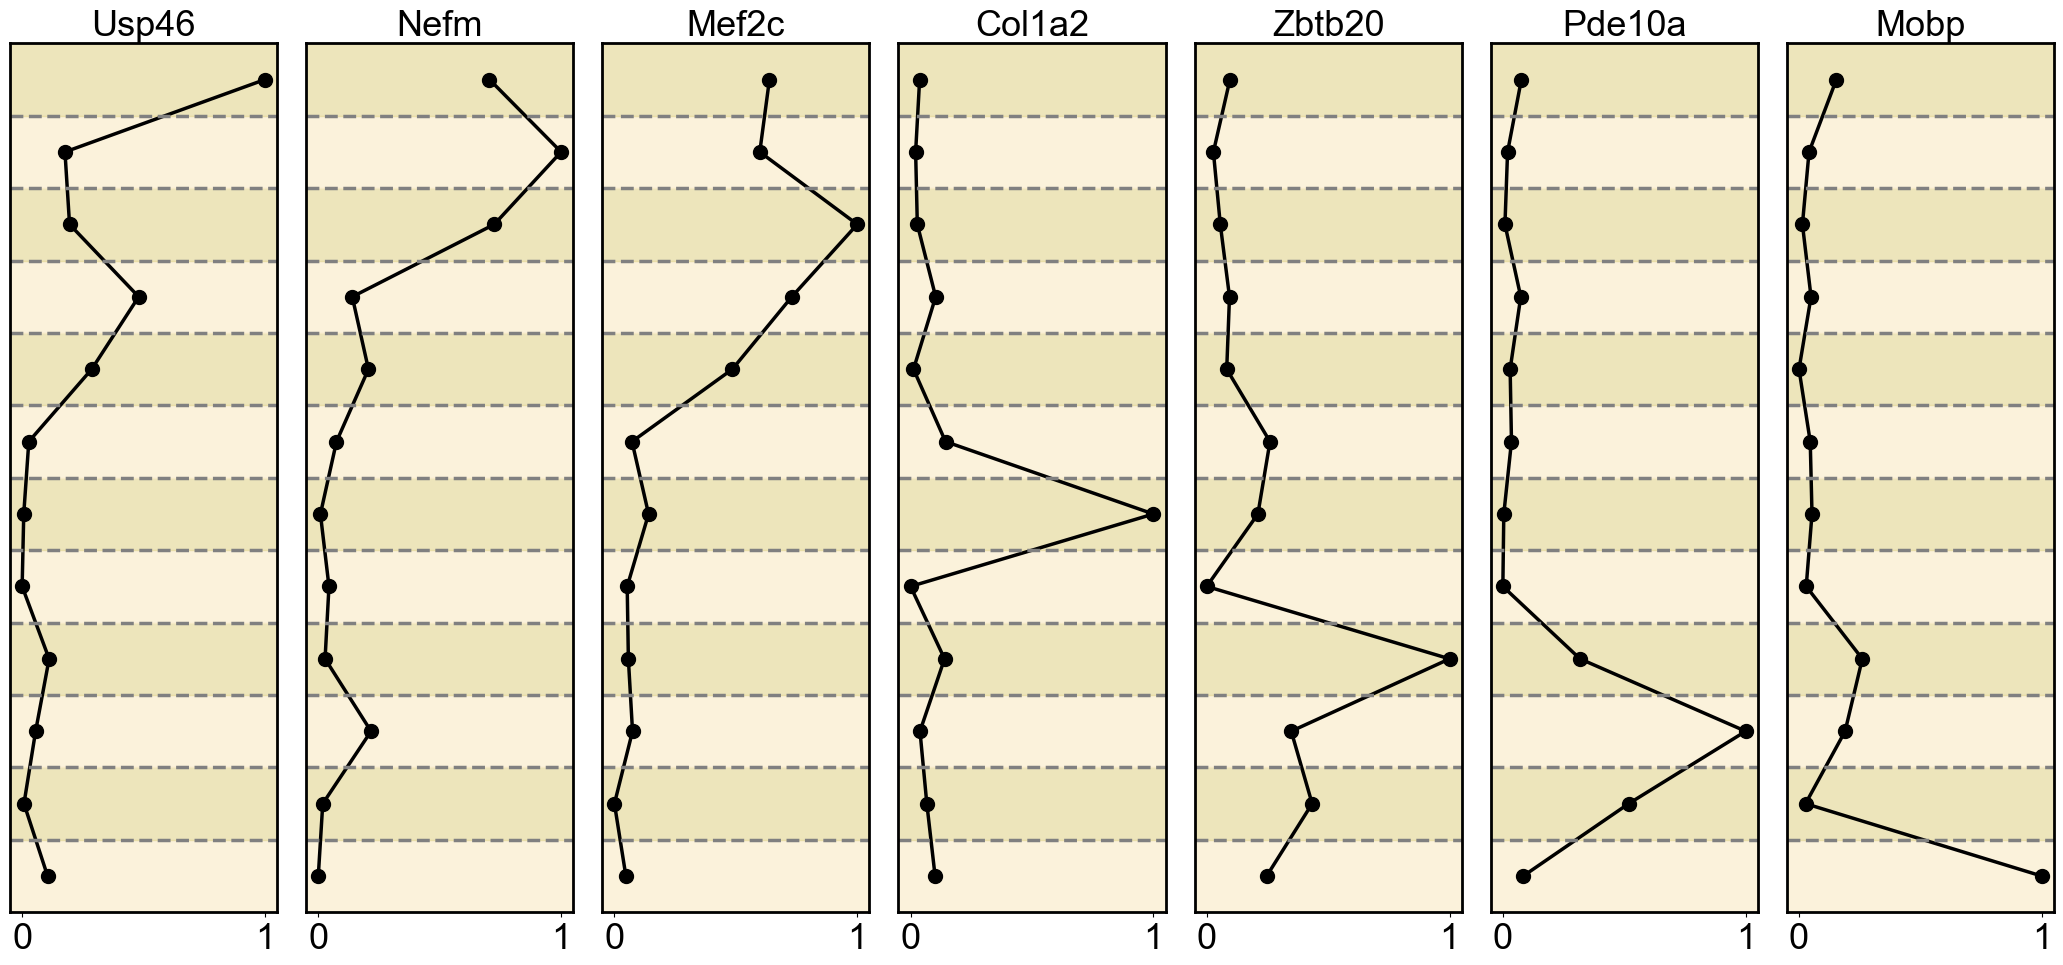
The PostScript backend does not support transparency; partially transparent artists will be rendered opaque.
[ ]:
import scanpy as sc
import pandas as pd
import numpy as np
from openpyxl import Workbook
from openpyxl.utils.dataframe import dataframe_to_rows
import warnings
warnings.filterwarnings('ignore')

# Define marker genes for each modality
gene_list = {
    'ATAC':     ['Cpne9', 'Nr4a2', 'Myh11', 'Sox4', 'Pde10a', 'Plp1'],
    'H3K4me3':  ['X3110035E14Rik', 'Mef2c', 'Syt1', 'C1ql3', 'Wipf3', 'Myh11', 'Pde10a', 'Mobp'],
    'H3K27ac':  ['Usp46', 'Nefm', 'Mef2c', 'Col1a2', 'Zbtb20', 'Pde10a', 'Mobp'],
    'H3K27me3': ['X3110035E14Rik', 'Mef2c', 'Syt1', 'C1ql3', 'Wipf3', 'Myh11', 'Pde10a', 'Mobp']
}

# Define slice names
slice_name = ['ATAC', 'H3K4me3', 'H3K27ac', 'H3K27me3']

# Define new cluster orders for each modality
new_orders = {
    'ATAC':     ["3", "2", "9", "7", "1", "10", "4", "8", "11", "0", "12", "5", "6"],
    'H3K4me3':  ["4", "2", "3", "7", "10", "5", "8", "11", "9", "1", "0", "6"],
    'H3K27ac':  ["2", "7", "3", "4", "10", "5", "9", "8", "11", "0", "1", "6"],
    'H3K27me3': ["3", "8", "9", "11", "2", "12", "4", "1", "6", "0", "10", "5", "7"]
}

# Create Excel file with multiple sheets
with pd.ExcelWriter('Marker_Gene_Data.xlsx', engine='openpyxl') as writer:

    for slice_id in range(4):
        current_slice = slice_name[slice_id]
        print(f"Processing slice: {current_slice}")

        # Load data files
        try:
            adata_modality_1 = sc.read_h5ad(f"../../../Data/Mouse_Brain_{current_slice}/adata_RNA.h5ad")
            adata_results = sc.read_h5ad(f"../../Mouse_Brain_{current_slice}.h5ad")
        except FileNotFoundError as e:
            print(f"File not found error: {e}")
            continue

        # Preprocess the RNA data
        sc.pp.filter_genes(adata_modality_1, min_cells=10)
        sc.pp.filter_cells(adata_modality_1, min_genes=200)
        sc.pp.highly_variable_genes(adata_modality_1, flavor="seurat_v3", n_top_genes=3000)
        sc.pp.normalize_total(adata_modality_1, target_sum=1e4)

        # ====== Extract spatial coordinates and gene expression ======
        print(f"  Extracting spatial coordinates and gene expression...")

        # Get spatial coordinates
        spatial_coords = adata_modality_1.obsm['spatial']

        # Create DataFrame for spatial data
        spatial_data = pd.DataFrame({
            'X_coordinate': spatial_coords[:, 0],
            'Y_coordinate': spatial_coords[:, 1]
        })

        # Add gene expression data
        for gene in gene_list[current_slice]:
            try:
                # Get expression values
                expression = adata_modality_1[:, gene].X
                if hasattr(expression, 'toarray'):
                    expression = expression.toarray().flatten()
                else:
                    expression = expression.flatten()

                # Add to spatial data
                spatial_data[f'{gene}_Expression'] = expression

            except KeyError:
                print(f"  Warning: Gene {gene} not found in {current_slice} dataset")
                continue

        # Save spatial data to Excel sheet
        spatial_sheet_name = f"{current_slice}_Spatial"
        if len(spatial_sheet_name) > 31:
            spatial_sheet_name = spatial_sheet_name[:31]

        spatial_data.to_excel(writer, sheet_name=spatial_sheet_name, index=False)
        print(f"  Saved spatial data to sheet: {spatial_sheet_name}")

        # ====== Extract cluster-specific mean expression ======
        print(f"  Extracting cluster-specific mean expression...")

        # Reorder clusters if needed
        try:
            if 'SpatialCOC' in adata_results.obs.columns:
                # Reorder SpatialCOC clusters
                adata_results.obs['SpatialCOC'] = pd.Categorical(
                    adata_results.obs['SpatialCOC'],
                    categories=new_orders[current_slice],
                    ordered=True
                )
        except Exception as e:
            print(f"  Warning: Could not reorder clusters: {e}")

        # Prepare cluster data
        cluster_data_list = []
        clusters_available = []

        if 'SpatialCOC' in adata_results.obs.columns:
            clusters_available = sorted(adata_results.obs['SpatialCOC'].unique())

        # Calculate mean expression for each cluster
        for cluster in clusters_available:
            # Get cells in this cluster
            cluster_cells = adata_results.obs[adata_results.obs['SpatialCOC'] == cluster].index

            # Calculate mean expression for each gene in this cluster
            cluster_expr_data = {}
            cluster_expr_data['Cluster'] = cluster

            for gene in gene_list[current_slice]:
                try:
                    # Get expression for cells in this cluster
                    gene_expression = adata_modality_1[cluster_cells, gene].X
                    if hasattr(gene_expression, 'toarray'):
                        gene_expression = gene_expression.toarray().flatten()
                    else:
                        gene_expression = gene_expression.flatten()

                    # Calculate mean expression
                    mean_expr = np.mean(gene_expression)
                    cluster_expr_data[f'{gene}_Mean_Expression'] = mean_expr

                except KeyError:
                    cluster_expr_data[f'{gene}_Mean_Expression'] = np.nan
                    continue
                except Exception as e:
                    print(f"  Error processing gene {gene} for cluster {cluster}: {e}")
                    cluster_expr_data[f'{gene}_Mean_Expression'] = np.nan
                    continue

            cluster_data_list.append(cluster_expr_data)

        # Create DataFrame from cluster data
        if cluster_data_list:
            cluster_data = pd.DataFrame(cluster_data_list)

            # Sort clusters according to specified order
            try:
                cluster_data['Cluster'] = pd.Categorical(
                    cluster_data['Cluster'],
                    categories=new_orders[current_slice],
                    ordered=True
                )
                cluster_data = cluster_data.sort_values('Cluster')
            except:
                # If reordering fails, keep original order
                pass

            # Set cluster as index
            cluster_data.set_index('Cluster', inplace=True)

            # Normalize expression values to 0-1 range
            print(f"  Normalizing expression values to 0-1 range...")
            gene_columns = [col for col in cluster_data.columns if col.endswith('_Mean_Expression')]

            for col in gene_columns:
                # Get data for normalization
                data = cluster_data[col].values

                # Skip if all values are NaN
                if not np.all(np.isnan(data)):
                    # Find min and max values
                    min_val = np.nanmin(data)
                    max_val = np.nanmax(data)

                    # Perform 0-1 normalization
                    if max_val != min_val:
                        # Standard 0-1 normalization
                        normalized_data = (data - min_val) / (max_val - min_val)
                    else:
                        # If all values are the same
                        if max_val == 0:
                            normalized_data = np.zeros_like(data)
                        else:
                            normalized_data = np.ones_like(data)

                    # Replace original data with normalized data
                    cluster_data[col] = normalized_data

                    # Rename column to indicate normalization
                    new_col_name = col.replace('_Mean_Expression', '_Normalized')
                    cluster_data.rename(columns={col: new_col_name}, inplace=True)

            # Save cluster data to Excel sheet
            cluster_sheet_name = f"{current_slice}_Cluster"
            if len(cluster_sheet_name) > 31:
                cluster_sheet_name = cluster_sheet_name[:31]

            cluster_data.to_excel(writer, sheet_name=cluster_sheet_name, index=True)
            print(f"  Saved cluster expression data to sheet: {cluster_sheet_name}")
        else:
            print(f"  No cluster data available (SpatialCOC clustering not found)")

print("Processing complete! Results saved to: Marker_Gene_Data.xlsx")